# In-Cluster Scanning
# About
The Insights Agent runs inside your cluster and sends back data to Fairwinds Insights. The data is then used to indicate specific security, reliability and efficiency issues in the cluster. These issues are called Action Items in Insights.
The Insights Agent comes with several different open source reporting tools, each of which can be configured independently using the Install Hub. To read more about the different report types, see the Reports Section.
# Installation
# Install Hub
When you create a cluster, you'll be taken to the Install Hub page for the cluster. To install the Insights Agent:
- Decide which reports you would like to run in your cluster
- Hover over each of the desired reports, then click the
Quick Addbutton at the bottom of the report - Click the
Ready to Installicon located in the top right corner of the page
Follow the instructions to install the Insights Agent with Helm. If you'd like to view the Kubernetes
manifests first, you can use helm template to generate the YAML files.
# Fleet Installation
To better serve customers with a large number of clusters, we've created a flow that allows you to easily deploy the Insights Agent across your fleet.
You can use the following commands to install the insights-agent in many clusters,
changing insights.cluster to a unique identifier for each cluster (e.g. generated using
your kube context).
kubectl delete job --all -n insights-agent
helm upgrade --install insights-agent fairwinds-stable/insights-agent \
  --namespace insights-agent \
  --create-namespace \
  --set fleetInstall=true  \
  --set insights.organization="$YOUR_ORGANIZATION" \
  --set insights.cluster="$CLUSTER_IDENTIFIER" \
  --set insights.tokenSecretName=insights-token \
  --set insights.apiToken="$YOUR_API_TOKEN"
With these flags set, the Helm chart will create a new cluster in the Insights UI with the specified name (unless a cluster with that name already exists) before installing the agent.
Here's a description of the flags above:
fleetInstall- Boolean - specify if this install is using the fleet install flowinsights.organization- String - the name your organization in Insightsinsights.cluster- String - the name you want to give this cluster in the Insights UI. You may want to auto-generate this from your kubectl contextinsights.tokenSecretName- String - the name of the secret where Insights will store your cluster's token. We recommendinsights-tokeninsights.apiToken- String - the admin token from your organization'sSettings > Tokenspage
You'll also want to set $report.enabled for each of the reports you want to run,
as well as any other chart options (opens new window)
Here is an example of installing the Insights Agent with the Polaris and Trivy reports inside a cluster named test-cluster within the test-org organization:
kubectl delete job --all -n insights-agent
helm upgrade --install insights-agent fairwinds-stable/insights-agent \
  --namespace insights-agent \
  --create-namespace \
  --set fleetInstall=true  \
  --set insights.organization="test-org" \
  --set insights.cluster="test-cluster" \
  --set insights.tokenSecretName=insights-token \
  --set insights.apiToken="thisIsTheTestOrgAdminToken1234567"
When reinstalling the Agent in the same cluster, you can omit apiToken and fleetInstall
and simply specify tokenSecretName.
This allows you to hand off control of the Agent to other teams without sharing your
organization's apiToken.
# Configuration
# Helm
The Insights Agent can be configured using Helm. To see the full list of options, check out the Insights Agent Helm chart. (opens new window)
In particular, for any given report type, you can set the following options:
enabled- Boolean - set totrueto enable the reportschedule- String - a Cron expression describing when to run this report. This is typically set to a random minute every hourtimeout- String - the maximum time this report should run before an error is triggered (seconds)resources- requests and limits for CPU and memory for this report
# Install Hub
You can customize any of the reports through the Install Hub:
- Visit your organization's
Clusterspage - After selecting a cluster, go to the
Install Hubpage - Click on a report and navigate to
Configure
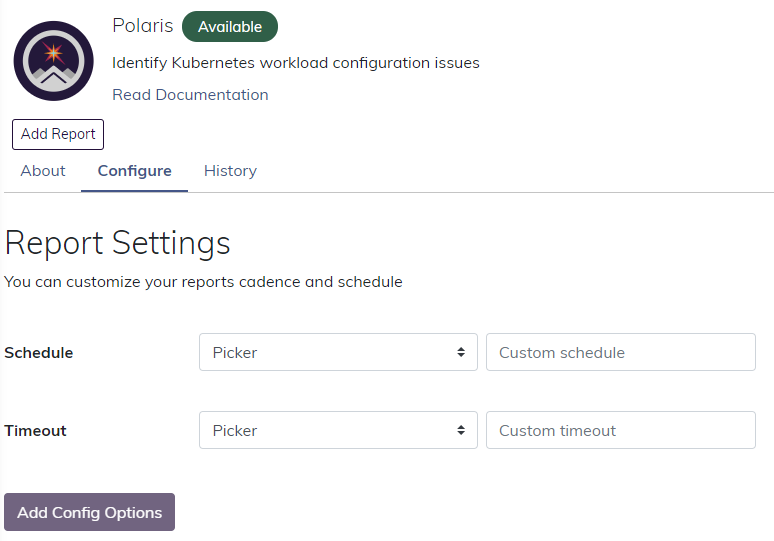
You will see the following options:
schedule- a Cron expression describing when to run this reporttimeout- the maximum time this report should run before an error is triggered (seconds)
These options will be reflected in the helm install command you'll see when you click Ready to Install
in the Install Hub.
Be sure to run the new command after making any changes here.
# Reporting
Insights tracks Action Item remediation progress over-time under the Action Items > Reports page. Insights will tally Action Item counts for the following dimensions:
- Introduced: The number of unique Action Items reported as 'new' for that date window
- Fixed: The number of Action Items that were verified as fixed and marked as
Fixed=True. A fixed Action Item is when the policy violation is no longer triggered and the Kubernetes resource continues to persist in the cluster. - Deleted: The number of Action Items that have been deleted from the system because the Kubernetes resource no longer exists in the cluster.
- Open: The number of Action Items that remained in the cluster for that given month
- Manually Resolved: The number of Action Items that were manually set as
Working as intendendorWon't fix.
# Reporting Fixed and Deleted Action Items
The below table outlines the logic Insights follows for deleting Action Items or marking them as "Fixed":
| Resource no longer exists in cluster | Resource is running in cluster | |
|---|---|---|
| Action Item is Fixed (Fixed=True) | Action Item will get deleted* | Action Item will be reported with these values - Fixed=True - Last Reported = date when Fixed |
| Action Item is Not Fixed (Fixed=False) | Action Item will get deleted* | Action Item will be reported with these values - Fixed=False - Last Reported = date of most recent report (usually < 1 hr) |
* Action Item deletion may take up to 1 hour after the resource is removed from the cluster.
# Troubleshooting
# Debugging
If you suspect something is wrong with the Insights Agent installation, you can use kubectl to
debug the problem.
After the agent runs, kubectl get pods should show something like this:
$ kubectl get pods -n insights-agent
NAME                                                    READY   STATUS      RESTARTS   AGE
goldilocks-5sh8s                                        0/2     Completed   0          18m
goldilocks-7pgp6                                        0/2     Completed   0          19m
insights-agent-goldilocks-controller-5b6b45d678-vgbrk   1/1     Running     0          19m
insights-agent-goldilocks-vpa-install-566h8             0/1     Completed   0          19m
kube-bench-dpvbz                                        0/2     Completed   0          18m
kube-hunter-tnmsw                                       0/2     Completed   0          18m
polaris-zk4px                                           0/2     Completed   0          18m
rbac-reporter-1583952600-kwmfz                          0/2     Completed   0          105s
rbac-reporter-sf9cz                                     0/2     Completed   0          18m
release-watcher-6lhm7                                   0/2     Completed   0          18m
trivy-8nw9d                                             0/2     Completed   0          18m
workloads-1583951700-dj6wb                              0/2     Completed   0          16m
workloads-q6gzt                                         0/2     Completed   0          18m
If any of the pods show an error, you can look at the logs. There are typically two containers per pod in the Insights Agent - one to run the auditing tool and another to upload the results. For example, here are typical logs for kube-bench:
$ kubectl logs kube-bench-dpvbz -n insights-agent -c kube-bench
time="2020-03-11T18:32:51Z" level=info msg="Starting:"
time="2020-03-11T18:32:51Z" level=info msg="Updating data."
time="2020-03-11T18:32:54Z" level=info msg="Data updated."
If nothing suspicious appears there, you might find an answer in the second container which uploads the results. It should end with something like this:
$ kubectl logs kube-bench-dpvbz -n insights-agent -c insights-uploader
  % Total    % Received % Xferd  Average Speed   Time    Time     Time  Current
                                 Dload  Upload   Total   Spent    Left  Speed
100  174k  100    16  100  174k     23   254k --:--:-- --:--:-- --:--:--  274k
+ exit 0
{"Success":true}
# Resource Limits
We have set reasonable resource requests and limits on each of the audits, but some clusters may push the boundaries of our assumptions. If you're seeing out-of-memory errors or other resource related issues, try setting higher resource limits.
If you're using the helm chart, you can do this by adding
--set $reportType.resources.limits.memory=1Gi
# or
--set $reportType.resources.limits.cpu=1000m
to your helm update --install command.
# Timeouts
We have set a reasonable timeout for each of the audits, but again, some clusters may
push the boundaries of our assumptions. If you're seeing timeout issues in the insights-uploader
container in one of the report types, you can adjust the timeout by adding:
--set $reportType.timeout=3600 # 3600s = 5min
to your helm update --install command.